
Master Statistical Process Control for Manufacturing Excellence
The Power of Control Charts in Industrial Automation
Statistical Process Control charts drive quality improvement across industries. They help manufacturers maintain consistent output quality. According to MarketsandMarkets, the global SPC software market will reach $12.8 billion by 2027. These tools are essential for Six Sigma and lean manufacturing initiatives.
Understanding Control Chart Fundamentals
Control charts monitor process behavior over time. They distinguish between common cause and special cause variation. This distinction helps teams identify real process issues. Common cause variation represents normal process fluctuations. Special cause variation indicates unusual events needing investigation.
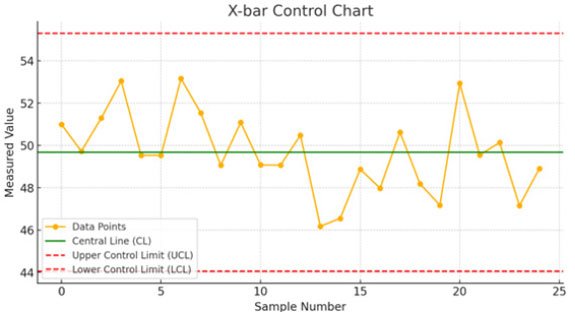
Key Components of Effective Control Charts
Every control chart contains several critical elements. The central line shows the process average. Upper and lower control limits define acceptable variation ranges. Data points represent actual process measurements. Time sequencing reveals patterns and trends. Proper calculation methods ensure statistical validity.
Major Control Chart Types for Manufacturing
Manufacturers use two primary control chart categories. Variable charts handle continuous data like dimensions or temperature. Attribute charts manage discrete data like defect counts. Choosing the right chart type is crucial for accurate monitoring.
Variable Control Charts:
• X-bar and R charts for subgroup means and ranges
• X-bar and S charts for means and standard deviation
• I-MR charts for individual measurements
Attribute Control Charts:
• P charts for proportion defective
• NP charts for number of defective items
• C charts for defect counts per unit
• U charts for defects with varying sample sizes
Implementing Control Charts in Production
Proper control chart implementation follows a structured approach. First, select the process characteristic to monitor. Then collect sufficient baseline data. Calculate control limits using statistical methods. Plot the data points in time sequence. Finally, analyze patterns for process insights.
Interpreting Control Chart Signals
Control charts reveal important process information. Stable processes show random variation within control limits. Unstable processes display specific patterns. Points outside control limits indicate special causes. Trends or cycles suggest systematic changes. Shifts in process average require investigation.
Benefits of Control Chart Implementation
Companies gain significant advantages from control charts. Early problem detection prevents major quality issues. Process stability improves consistently. Data-driven decisions replace guesswork. Reduced waste lowers production costs. Continuous improvement becomes systematic.
Implementation Challenges and Solutions
Control charts present some implementation challenges. Initial setup requires statistical knowledge. Staff training prevents misinterpretation. Historical data limitations exist. However, these challenges have practical solutions. Proper training and tool selection ensure success.
Real-World Application Scenario
Situation: Automotive parts manufacturer faces dimensional variation issues.
Solution: Implement X-bar R charts for critical dimensions.
Process: Monitor subgroup measurements every hour.
Result: Reduced variation by 40% in three months.
Expert Insight from World of PLC
Control charts integrate seamlessly with modern automation systems. PLC and DCS platforms can automate data collection. This eliminates manual recording errors. Real-time SPC enables immediate corrective actions. For optimal implementation, explore advanced control system solutions that support statistical quality control.
Industry Applications Beyond Manufacturing
Control charts serve multiple industries effectively. Healthcare monitors patient treatment processes. Service industries track customer satisfaction metrics. Supply chains manage delivery performance. Any process benefiting from variation reduction can use control charts.
Frequently Asked Questions
How often should control limits be recalculated?
Recalculate limits when process improvements occur. Regular reviews should happen quarterly. Significant changes demand immediate updates.
Can control charts work with automated data collection?
Yes. Modern PLC systems can feed data directly to SPC software. This enables real-time process monitoring and faster response.
What sample size works best for control charts?
Subgroup sizes of 4-5 typically work well for variable charts. Larger samples increase detection sensitivity but cost more to collect.
This feature originally appeared in the August/September issue of Automation.com Monthly.


