Optimizing Safety Instrumented Systems: A Practical Guide to SIL, PFDavg, and Proof Test Coverage
Introduction to Functional Safety Performance
Industrial automation systems require rigorous safety validation. Many engineers focus heavily on Safety Integrity Levels (SIL) and test frequency. However, they often underestimate proof test coverage (Cpt). This critical factor determines how well testing identifies dangerous failures. According to World of PLC analysis, proper Cpt understanding separates compliant safety systems from potentially hazardous ones.
What Exactly Is Proof Test Coverage?
Proof test coverage measures testing effectiveness. Specifically, it represents the percentage of dangerous undetected failures that your proof test can detect. A Cpt of 100% means perfect failure detection. Conversely, 70% coverage means 30% of dangerous failures remain hidden. These undetected failures accumulate over time. Consequently, they significantly increase your system’s risk profile.
The Direct Impact of Cpt on PFDavg
The average Probability of Failure on Demand (PFDavg) determines SIL ratings. Many training courses use simplified equations. These equations assume perfect test coverage. Real-world scenarios require more accurate calculations. Therefore, you must include Cpt in your PFDavg formula:
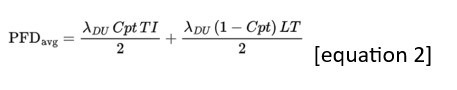
Where:
λDU = Dangerous undetected failure rate
TI = Proof test interval
LT = Safety system lifetime
Cpt = Proof test coverage
Real-World SIL Calculation Comparison
Consider this practical scenario using industry-standard parameters:
✅ Base Parameters:
λDU = 2E-6 per hour
TI = 1 year (8,760 hours)
LT = 15 years (131,400 hours)
⚙️ Case A: Cpt = 0.55
PFDavg ≈ (2E-6 × 0.55 × 8760)/2 + (2E-6 × 0.45 × 131400)/2 = 1.04E-2
Risk Reduction Factor (RRF) ≈ 96 → SIL 1
🔧 Case B: Cpt = 0.95
PFDavg ≈ (2E-6 × 0.95 × 8760)/2 + (2E-6 × 0.05 × 131400)/2 = 2.06E-3
Risk Reduction Factor (RRF) ≈ 485 → SIL 2
This demonstrates how Cpt alone can change SIL ratings. Both cases used identical components and test intervals. The difference emerged solely from test coverage quality.
Realistic Cpt Values for Common Components
Industry data reveals typical coverage ranges:
| Component | Typical Cpt Range | Critical Factors |
|---|---|---|
| Pressure Transmitter | 85% to 95% | Calibration method and range testing |
| PLC/DCS Logic Solver | 95% to 99% | Diagnostic coverage and self-testing |
| Final Element (Valve) | 50% to 95% | Stroke testing completeness and frequency |
Determining Accurate Cpt Values
Your approach depends on equipment certification status. For IEC 61508-certified devices, consult the manufacturer’s FMEDA. This analysis provides validated Cpt data. For non-certified components, use proven industry data sources. OREDA database statistics offer reliable failure rates. Additionally, reference established safety engineering resources.
Common Cpt Misconceptions in Industry Practice
Many engineers confuse Cpt with diagnostic coverage. However, they serve different purposes. Diagnostic coverage involves automatic self-checks. Conversely, Cpt relates to manual or scheduled testing procedures. Another misconception involves test frequency. Increasing test frequency cannot compensate for poor coverage. A comprehensive test every two years often outperforms inadequate annual testing.
Practical Implementation Strategies
World of PLC recommends these implementation steps:
✅ Step 1: Prioritize IEC 61508-certified components when possible
✅ Step 2: Document exact test procedures and coverage assumptions
✅ Step 3: Match field testing to manufacturer’s FMEDA conditions
✅ Step 4: Implement partial-stroke testing with full-stroke validation
✅ Step 5: Train maintenance teams on coverage implications
Industry Application Case Study
A chemical processing plant struggled with SIL 2 compliance. Their safety valves achieved only 60% Cpt through partial-stroke testing. By implementing quarterly full-stroke tests (90% Cpt), they improved PFDavg by 42%. This upgrade maintained SIL 2 compliance without hardware changes. The solution demonstrates that optimized testing often delivers better ROI than component replacement.
Expert Recommendations for System Improvement
World of PLC suggests these coverage enhancement strategies:
⚙️ For Existing Systems: Enhance test procedures with position feedback and leak detection
🔧 For New Designs: Select inherently testable components with high diagnostic coverage
📊 For Validation: Use third-party verification for critical safety functions
Frequently Asked Questions
Q1: How does Cpt differ from diagnostic coverage in industrial controllers?
Cpt measures manual test effectiveness, while diagnostic coverage evaluates built-in self-monitoring. For example, Siemens S7-1500 controllers provide 99% diagnostic coverage through internal checks, but Cpt depends on your specific testing procedures.
Q2: Can frequent testing compensate for low Cpt values?
No, frequency and coverage address different risk aspects. According to ISA 61511 analysis, doubling test frequency with 50% Cpt provides less improvement than maintaining frequency with 90% Cpt.
Q3: What’s the most overlooked factor in valve Cpt determination?
Seat leakage testing is frequently omitted. Full stroke testing might miss this failure mode. Adding pressure decay tests can increase valve Cpt from 70% to over 90%.
Conclusion and Next Steps
Proof test coverage significantly impacts functional safety performance. Understanding Cpt principles helps optimize safety instrumented systems. Moreover, proper implementation ensures IEC 61511 compliance. For specific component recommendations and technical support, visit World of PLC’s comprehensive resource library. Our expertise in industrial automation can help you achieve both safety and operational excellence.


%20and%20test%20frequency.%20However,%20they%20often%20underestimate%20proof%20test%20coverage%20(Cpt).%20This%20critical%20factor%20determines%20how%20well%20testing%20identifies%20dangerous%20%5B…%5D&media=https://www.oiltechcontrols.com/wp-content/uploads/2025/10/AUTO-Monthly-AUGSEP-Functional-Safety-Merten-TitlePage-500x313.jpgwidth500height313ext.jpg)
This guide breaks down complex SIL proof test methods into actionable steps. We used similar coverage strategies in a refinery upgrade—audits went flawlessly.